

Is your health center's Accounts Receivable lower than 50 days? Does your billing department have the expertise to identify potential billing issues? If the answers to these questions are no, your Revenue Cycle may need some help. The Revenue Cycle is a vital part of a health center’s inner workings. In this new mini-blog series, we will discuss some Key Performance Indicators (KPIs) that can identify trends, recognize potential issues, and evaluate the effectiveness of your revenue cycle department. In this post, we will look at Days in Accounts Receivable (A/R) and the Percent of A/R over 90 Days in Nextgen Practice Management.
Days in A/R show the average total days it takes to receive reimbursement. The lower the number, the faster you are obtaining payment. Here are some benchmark numbers: <35 days shows high performance, 35-50 days shows average performance and 50+ days shows poor performance. If you’re over 50 days in A/R, there may be a problem in the revenue cycle your health center needs to address.
Identifying KPIs in NextGen
Let’s look at how to measure Days in A/R to assess your health center’s performance. First, calculate your average daily charges using a specific period of time (3, 6, or 12 months – whatever works best for your health center). We will use a 12-month period for our example.
- Total Charges for 12 months = $3,500,000
- Days in 12 months = 365 days
- Average daily charges: $3,500,000 / 365 = $9,589.04
Next, calculate Days in A/R by dividing the total accounts receivable by the average daily charges.
- Total Accounts Receivable = $450,000
- Average Daily Charges = $9,589.04
- Days in A/R: $450,000 / $9589.04 = 46.9 days
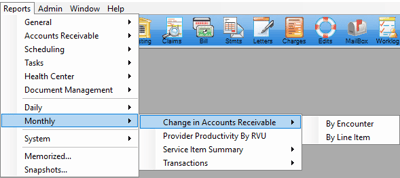
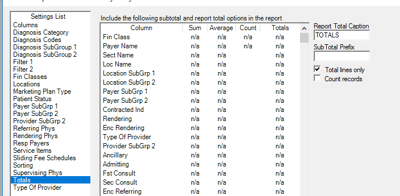
To do this in NextGen, there is a simple report to calculate Days in A/R. To find it, go to Monthly → Change in Accounts Receivable → By Line Item
Columns: Charge Amount and Ending A/R
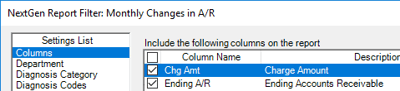
Filter 1: Process Date = Previous 12 months (or other desired range)
![]()
Sorting: Remove all sorting checkmarks
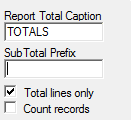
Totals: Check Total Lines Only
When you run the report in NextGen, you will get something similar to this:
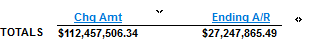
- Average Daily Charge: $112,457,506.34 / 365 = $308,102.76
- Days in A/R: $27,247,865.49 / $308,102.76 = 88.44 Days
Be sure to review the info tab on the report filter. This will give you notes about the report and what the report ties into so you can ensure you’re not getting skewed data.
This example is on the high end of Days in A/R. If you get a number like this, it’s a good idea to break the information down to see why it might be this high. You can filter by financial class to compare self-pay vs. third-party payers and go from there.
The next KPI we will review is calculating Accounts Receivable over 90 Days. This is the percentage of A/R that is over 90 days from the date of service. This conveys your health center’s ability to collect claims in a timely manner. Most payers pay within 30 days, so if you have a high or rising percentage of A/R over 90 days, that’s a red flag signaling an issue in your health center’s revenue cycle. Here are some benchmark numbers for A/R over 90 days: <20% shows high performance, 21-30% shows average performance, and >30% shows poor performance.
Here's how to calculate A/R over 90 days: total A/R over 90 days divided by total A/R x 100.
- Total A/R = $100,000
- A/R over 90 days = $20,000
- $20,000 / $100,000 = .20
- . 20 x 100 = 20 or 20%
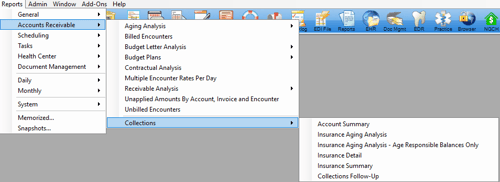
To do this in NextGen, go to Accounts Receivable → Collections → Insurance Aging Analysis
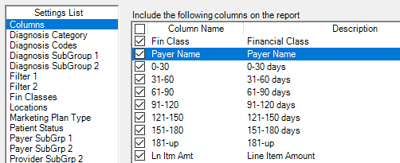
Recommended Columns: Fin Class, Payer Name, 0-30, 31-60, 61-90, 91-120, 121-150, 151-180, 181-up and, Ln Item Amt
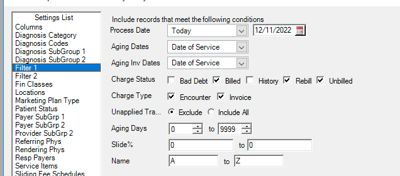
Filter 1:
- Process Date: Today
- Aging Dates: Date of Service
- Charge Status: Billed, Rebill, Unbilled
- Charge Type: Encounter, Invoice
- Unapplied Transactions: Exclude Aging Days: 0-9999
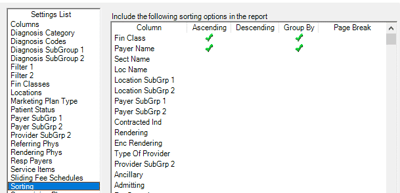
Sorting:
- Fin Class: Ascending and Group By
- Payer Name (optional): Ascending and Group By. Including the Payer Name will give you a detailed report, leaving it out will give you a high-level report
Totals:
- Remove Text in Sub Total Prefix
- Check Off: Total Lines Only
Your results should look like this (if you don’t group by payer name):
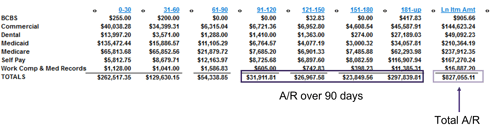
Add columns 91-120, 121-150, 151-180, and 181-up to get a total over 90 days.
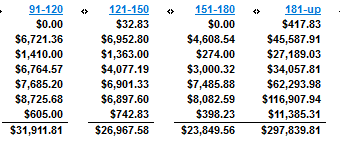
- Total over 90 days = $380,468.76
- Tip: Export to Excel to add formulas for calculations
Divide total A/R over 90 days by total A/R, then multiply by 100 to get % of A/R over 90 days.
- $380,468.76 / $827,055.11 = .46
- .46 x 100 = 46%
When you’re looking at your percentage of A/R over 90 days, there are some important things to consider:
- Credit Balances
- Self-Pay Policies – Questions to ask regarding self-pay policies:
- Should the balances be written off?
- Are you billing patients at all?
- Consider total calculation vs. calculation of third-party payers.
- Self-pay policies are a significant factor in the Community Health Center space.
- Credentialing
- Payer Processing Issues
- Charge / Claim Submission Lags
- Other “Contributing Factors”
Your health center might want to create a “contributing factors” spreadsheet. Input your A/R over 90 days then quantify and remove factors out of your control to see where your health center falls on the benchmark so you can figure out how to lessen that number.
Managing the revenue cycle is a complex process that requires careful attention and expertise. Hopefully, these KPIs can help optimize your health center’s revenue cycle and improve financial stability. Stay tuned for the next two posts in this mini-blog series where we review two additional KPIs of the Revenue Cycle.
Resources: Measuring Your Revenue Cycle Performance