

Do you know your health center’s denial rate and trends? If not, this installment of our mini-blog series overviewing Key Performance Indicators of the Revenue Cycle in NextGen will cover how to discover your denial rate and top denials so you can improve your clean claim rate and your health center’s Revenue Cycle health overall.
What are denial rates and trends? The denial rate represents the percentage of claims denied by payers during a given period. Denial trends show the top reasons claims are getting denied. Denial reason codes can tell a story about what is happening within your revenue cycle.
Denial Rate
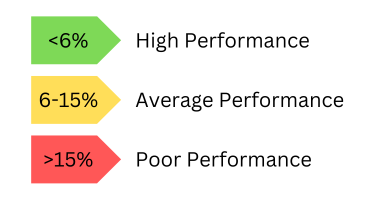 A low denial rate is desirable and an indicator that your revenue cycle management practices are successful. A denial rate of <6% indicates high performance, 6-15% indicates average performance, and >15% indicates poor performance.
If you have poor performance with denial rates, get to the root of the problem. Is it coding, credentialing, or something else? In the Federally Qualified Health Center (FQHC) space, there are some denials that are expected. Claims using Medicare can get complicated; Medicare pays on the G code (a report used to document a beneficiary's functional limitations and treatment progress that includes information on the beneficiary's current status, projected goal status, or discharge status) but denies the E&M code (represents services provided by a physician or other health care professional who evaluates or manages a patient's health). The system will say it’s denied even if it’s paid in full, which makes the report more challenging. Understanding the denial rates and trends is important to know what denials are within your health center’s control.
Calculate Denial Rate
There are two ways to calculate the denial rate:
- Take the total dollar amount of claims denied by payers divided by the total dollar amount of claims submitted within a given period OR
- Take the total number of claims denied by the total claims submitted within a given period.
The second option makes more sense in an FQHC setting.
Example Calculation:
- Total dollar amount of claims denied: $40,000
- Total dollar amount of claims submitted: $600,000
- Time Period: 1 month
- $40,000 / $600,000 = .067
- Denial Rate = 6.7%
Denial Trends
Your health center can utilize the power of NextGen reporting to identify top denial reason codes.
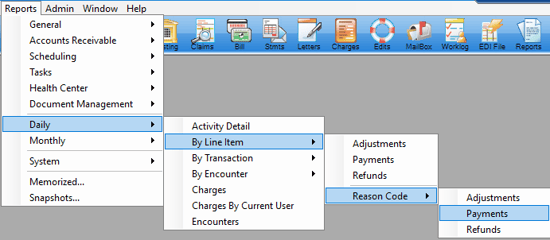
NextGen Report: Reports > Daily > By Line Item > Reason Code > Payments
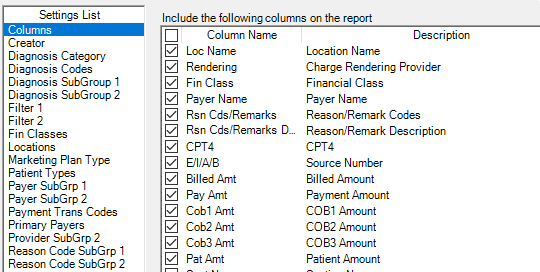
Recommended Columns: Loc Name, Rendering, Financial Class, Payer, Reason / Remark Code, Rsn Cds/ Remarks Description, CPT4, E/I/A/B, Billed Amt, Pay Amount, COB1 Amount, COB2 Amount, COB3 Amount, Pat Amount
The more columns, the better. More information will be available, and the opportunity to drill down into CPT codes denied, diagnosis, place of service, etc.
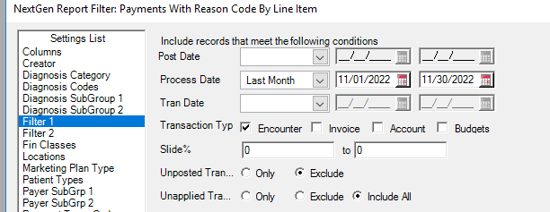
Filter 1:
- Process Date: Last Month (or a specific period) might be a good thing to run each month as part of your monthly reports.
- Transaction Type: Encounter
- Unposted Tran: Exclude
- Unapplied Tran: Exclude
Filter 2:
- Pay Amt: Equals $0.00

- COB1 Amt: Greater than $0.00

Run filter two more than once, with COB2 and COB3 greater than $0.00 to get secondary and tertiary denials as well. This is crucial because most of the time you’re dealing with a primary payer or there’s only one payer.
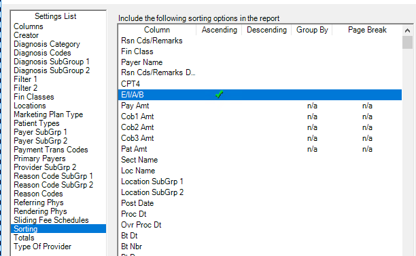
Sorting: E/I/A/B Ascending
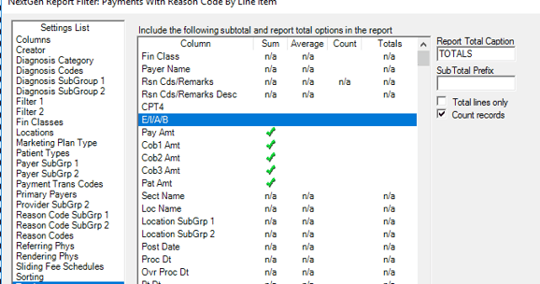
Totals:
- Delete "Totals For" in the Sub Total Prefix box
- Uncheck "Total lines only"
- Check "Count Records"
Run the Report and export results to Excel.
![]()
As mentioned, you’ll want to run other reports for COB2 and COB3 denials. Pivot the Excel report results to view by denial reason code and sort it by highest to lowest.
Pivot Example:
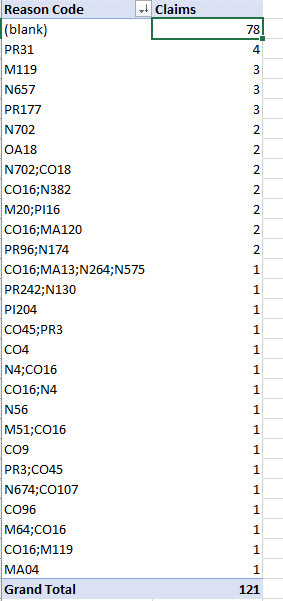 Blanks = no reason code posted
.
This s
hows
a b
reakdown in the
process
at the payment posting level.
Blank reason codes
make
it
h
ard to trend this health center.
Blanks = no reason code posted
.
This s
hows
a b
reakdown in the
process
at the payment posting level.
Blank reason codes
make
it
h
ard to trend this health center.
Top Denials – example of top denials from an RCM client
CO22 – 83 claims - This care may be covered by another payer per coordination of benefits. (This is an eligibility issue)
CO252 / N4 – 82 claims - 1. An attachment/other documentation is required to adjudicate this claim/service 2. Missing/incomplete/invalid prior insurance carrier EOB (This is an eligibility issue)
Blank – 53 claims - Denial code not posted with the transaction
CO24 - 35 claims - Charges are covered under a capitation agreement/managed care plan. (This is a registration issue)
CO97 - 29 claims - The benefit for this service is included in the payment/allowance for another service/procedure that has already been adjudicated. (This is an expected denial)
Once your health center’s top denial trends have been discovered, begin to work on the top rejection reasons. Identifying simple fixes and creating workflows to implement them is an easy way to decrease the number of denials your health center receives. For more complicated fixes, CyclePoint RCM can help identify problem areas and rework denied claims.
Resources: Measuring Your Revenue Cycle Performance