

Ensuring a healthy Revenue Cycle requires maintaining a high rate of clean claims. In this second installment of our mini-blog series overviewing Key Performance Indicators (KPIs) of the Revenue Cycle, we will discuss how to calculate your health center's clean claim rate.
What is a clean claim rate? The number of claims submitted to payers is accepted without intervention from the clearinghouse or the payer. It does not include payer edits or payer denials. Your health center should aim for a clean claim rate of 95% or higher. If your clean claim rate is below 95%, you might want to look at your denial rate and denial trends to find where the issue is occurring in your health center.
Calculating Clean Claim Rate
To calculate your health center’s initial clean claim rate, you will need two numbers – the number of claims submitted, and the number of claims rejected at the clearinghouse or by the payer.
Example Calculation:
- Total Claims Submitted (4500) minus total rejected claims (450) to find the total claims accepted
- Divide the total claims accepted by the total claims submitted
- Multiply the result by 100 to get the clean claim rate
- 4500 – 450 = 4050
- 4050 / 4500 = .9
- .9 x 100 = 90%
The best way to do this is not with NextGen, it is best to rely on your clearinghouse to provide the data. We will show examples from two popular clearinghouses: TriZetto and NextGen.
TriZetto Example:
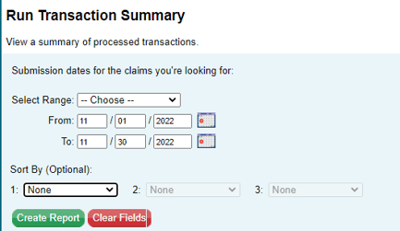
Here is what it will look like to get your data if TriZetto is your clearinghouse:
Reports > Run Transaction Summary
Choose the date range you want to view. This example will show one month of transactions.
Transaction Summary:
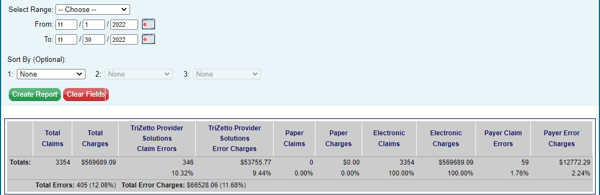
- 3354 – 405 = 2949
- 2949 / 3354 = .88
- .88 x 100 = 88% clean claim rate
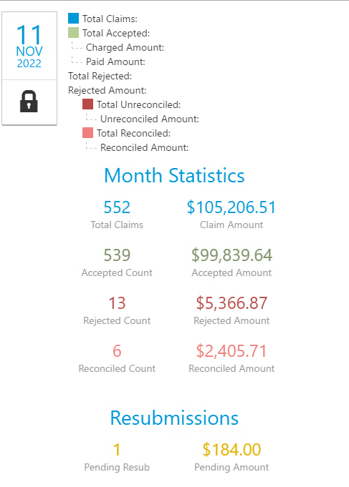
- 552 – 13 = 539
- 539 / 552 = .98
- .98 x 100 = 98%
Each clearinghouse is different, but most will report your top rejection reasons. Once you calculate your clean claim rate, you can begin to investigate denials to try to improve your rate. Many rejections are easy fixes, like removing dashes in provider hyphenated last names or checking a box in NextGen file maintenance, so the CLIA number goes out on the claim.
You might be able to import claim status files into NextGen, it is clearinghouse dependent. Most clearinghouses will give you access to your 999 and 277 files, which can be imported into NextGen to then use NextGen reporting to look at your clean claim rate. Importing your claim status files will take some time to set up at the front end and will need ongoing management but it will pay off. Usually, rejections do not get worked because they get stuck in the clearinghouse. Having your claim status files in NextGen allows your health center to see rejections and task staff to work on those rejections.
We hope this overview of the clean claim rate KPI can help enhance the financial stability of your health center. The following KPI we will cover is denial trends and how to discover your health center’s top trends so you can address denial codes head-on.
Resources: Measuring Your Revenue Cycle Performance